


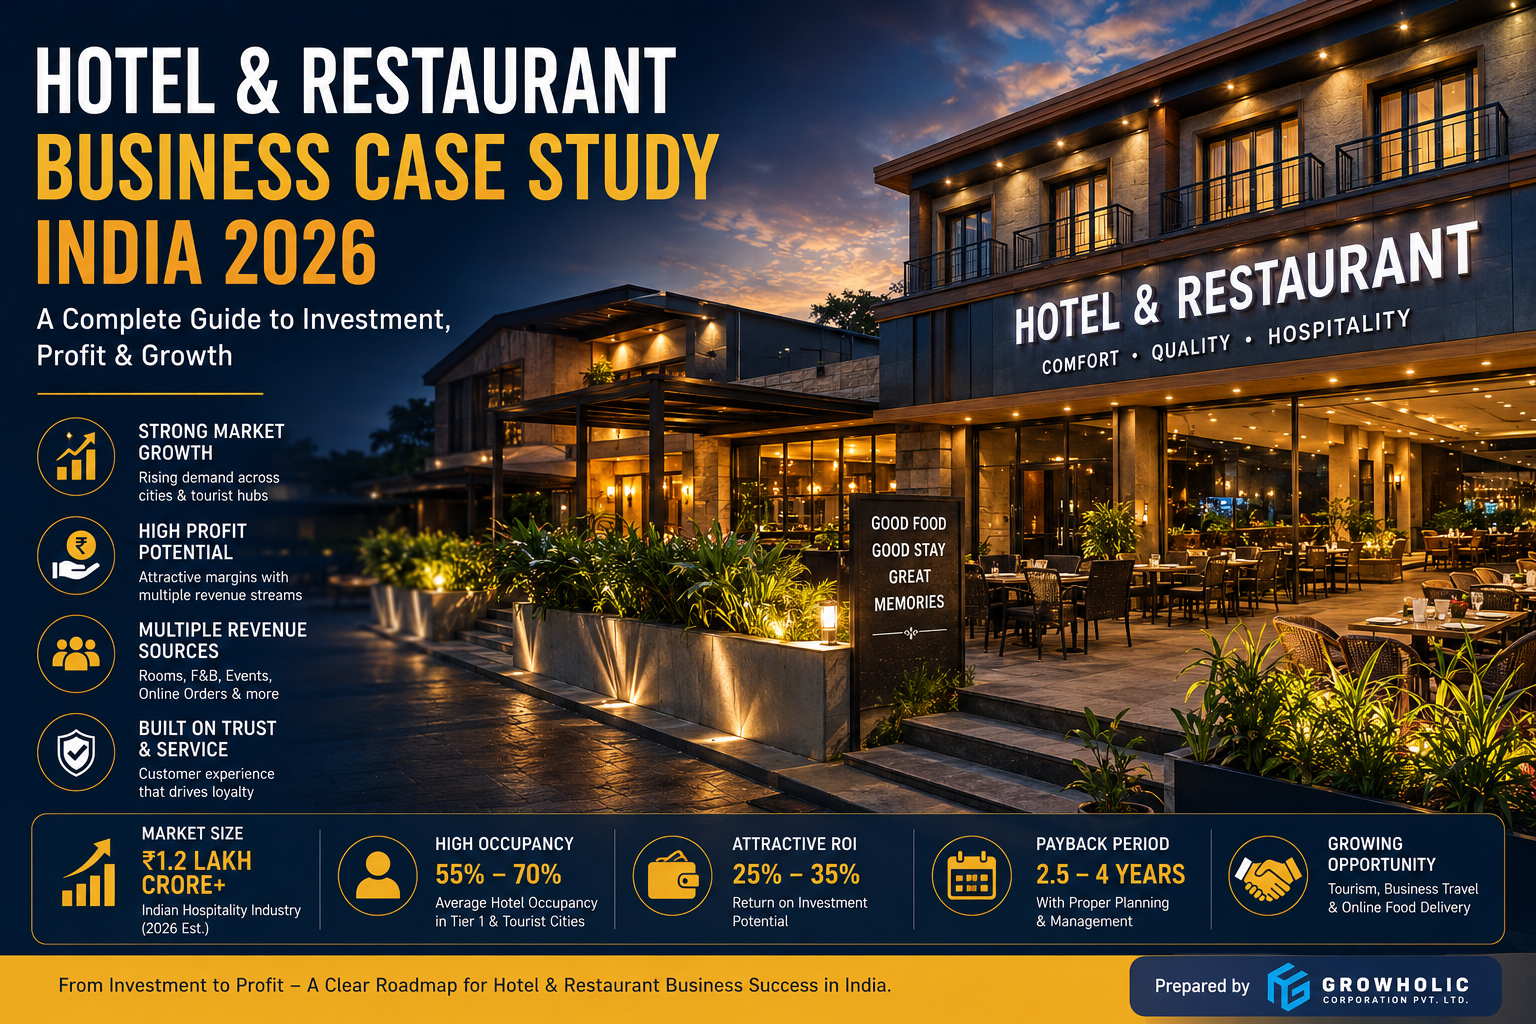
A real-numbers blueprint for starting and running a hotel or restaurant business in India — from first investment to first year of profit.
India's food-service and hospitality industry is one of the fastest-growing consumption sectors in the country. Tier-2 and tier-3 cities are now growing faster than metros as chains expand beyond saturated markets. Yet most first-time owners enter with guesswork instead of numbers — they know they want to "open a restaurant" but can't answer how much money they need, how many staff to hire, or when they'll turn a profit. This case study answers those questions with real, usable figures.
| Format | Investment | Best Suited For |
|---|---|---|
| Restaurant (full-service) | ₹15L – ₹1Cr+ | City & residential areas |
| Fast Food Outlet | ₹8L – ₹40L | Malls, colleges, high footfall |
| Family Restaurant | ₹25L – ₹80L | Residential & commercial hubs |
| Fine Dining | ₹1Cr – ₹3Cr+ | Metro cities, affluent catchments |
| Cafe | ₹10L – ₹35L | Near offices, colleges |
| Highway Dhaba | ₹15L – ₹50L | Highways, transit routes |
| Lodge | ₹30L – ₹1.5Cr | Small towns, pilgrim/transit spots |
| Resort | ₹2Cr – ₹10Cr+ | Tourist destinations |
| Cloud Kitchen | ₹5L – ₹20L | Dense urban delivery zones |
| Food Truck | ₹4L – ₹15L | Events, testing a new concept |
Dine-in, takeaway, delivery, catering, party orders, corporate meal contracts, and monthly tiffin/subscription plans each carry different margins and stability. Outlets running 2–3 channels together (e.g., dine-in + delivery + corporate orders) recover from slow seasons far faster than single-channel outlets.
Before signing any lease, evaluate:
Highways suit dhabas and fast food; city centres suit fine dining and cafes; residential areas suit family restaurants and cloud kitchens; office districts suit cafes and tiffin services.
Three planning scenarios are used throughout: Small (₹15–30L), Medium (₹50L–₹1Cr), and Premium (₹2Cr+).
| Investment Head | Small | Medium | Premium |
|---|---|---|---|
| Rent Deposit | ₹1.5–3L | ₹5–10L | ₹25–50L |
| Civil Work & Renovation | ₹2–5L | ₹8–15L | ₹40–80L |
| Interior & Décor | ₹2–4L | ₹10–20L | ₹60–120L |
| Kitchen Setup | ₹3–6L | ₹10–18L | ₹35–60L |
| Furniture | ₹1.5–3L | ₹5–9L | ₹20–35L |
| Licenses & Registrations | ₹0.3–0.6L | ₹0.6–1L | ₹2–4L |
| Working Capital (2–3 months) | ₹1.5–3L | ₹5–10L | ₹25–45L |
Fixed costs (recur regardless of sales) — rent, EMI, electricity, gas, insurance, GST/CA filing, POS subscriptions, maintenance reserve, security, and music licensing. For a Medium outlet, expect roughly ₹10–18L/month all-in at scale.
Variable costs — raw materials (vegetables, protein, staples, beverages), packaging, and hygiene consumables. As a rule of thumb: food cost should stay between 28%–35% of revenue, with packaging/hygiene adding another 3–6%.
A Medium-format outlet typically needs a manager, cashier(s), chef and assistant chefs, tandoor/specialty cooks, kitchen helpers, dishwashers, waiters, a captain, cleaners, security, and delivery staff — roughly 25–35 people at full scale.
Indicative monthly salaries (tier-1/2 city, 2026): Manager ₹30–50K, Chef ₹25–45K, Waiter ₹10–15K, Helper ₹10–14K, Cashier ₹14–20K — plus PF/ESIC and bonus where applicable.
FSSAI license, GST registration, Shop & Establishment Act license, Trade license, Fire NOC, Pollution consent (if applicable), Music license (PPL/IPRS), Health/Eating House license, Labour registration, and Signboard permission.
A focused menu of 40–60 well-executed items consistently outperforms a 150-item menu that stretches kitchen quality thin. Structure it across breakfast, lunch (thali/combo for volume), dinner (higher-margin à la carte), snacks, beverages, desserts, and a kids' menu, with seasonal and festival specials rotated in.
Core pricing formulas:
Pricing approaches: Premium (justified by ambience/exclusivity), Competitive (matched to nearby outlets), and Psychological (₹199 instead of ₹200) for combos and delivery menus.
POS billing system, inventory management software, a Kitchen Display System, QR-code menus, Swiggy/Zomato integration, UPI payments, and a basic CRM for repeat-visit and loyalty tracking. These are now baseline requirements, not upgrades.
Stabilised monthly numbers (month 6–12 of operation):
| Metric | Small | Medium | Premium |
|---|---|---|---|
| Monthly Sales | ₹4–7L | ₹12–22L | ₹50L–₹1Cr+ |
| Gross Profit | ₹2.7–4.8L | ₹8.2–15L | ₹34–68L |
| Net Profit (before tax) | ₹0.5–1L | ₹1.7–3.5L | ₹8–16L |
| Net Margin | ~10–14% | ~13–16% | ~15–18% |
| Break-even Timeline | 10–16 months | 14–20 months | 24–36 months |
| Annualised ROI | 20–35% | 22–38% | 18–30% |
| Risk | Mitigation |
|---|---|
| Poor location | Run a 2–3 day footfall count before signing the lease |
| High rent | Cap rent at 8–10% of expected monthly revenue |
| Food wastage | Daily wastage tracking, FIFO, portion control |
| Staff turnover | Fair pay, a clear growth path, scheduled training |
| Negative reviews | Respond within 24 hours, fix the root cause |
| Seasonality | Build a monsoon / post-festival cash reserve |
| Food inflation | Lock vendor rates for 3–6 months where possible |
Signing a lease on rent affordability alone without validating footfall; overloading the menu past 150 items; cutting ingredient quality to save cost; assuming good food alone brings customers without any marketing; treating hygiene as a one-time task instead of a daily discipline; and both over- and under-staffing relative to actual demand.
Open a second branch only after the first is consistently profitable for 6+ months in a similar catchment. Consider franchising once your recipes, training, and SOPs are documented well enough for someone else to replicate. A cloud kitchen is the lowest-capital way to enter a new micro-market using your existing kitchen and brand. Once you run 3+ outlets, a central kitchen cuts per-outlet cost and standardises quality.
| KPI | Formula | Healthy Benchmark |
|---|---|---|
| Food Cost % | Cost of food sold ÷ Food revenue × 100 | 28%–35% |
| Labour Cost % | Total staff cost ÷ Total revenue × 100 | 22%–28% |
| Net Profit Margin | Net profit ÷ Total revenue × 100 | 8%–15% |
| Customer Retention | Repeat customers ÷ Total customers × 100 | 25%+ |
| Table Turnover | Seatings ÷ Tables per day | 2–4 for dine-in |
Every format — dhaba to fine dining — runs on the same three engines: production, service delivery, and cash-flow management. The owners who succeed are the ones who treat this as a numbers business from day one: they validate location with real footfall counts, keep food cost and labour cost within benchmark ranges, build more than one revenue channel, and stay disciplined on hygiene and vendor management long after the opening-week excitement fades.
Related reading: Retail Electronics Business Case Study — India 2026
Published by Growholic Corporation
Disclaimer: All figures are indicative estimates for planning purposes only, based on general industry patterns across Indian cities in 2026. Actual costs, revenues, and timelines vary by city, location, execution quality, and market conditions. This is not financial, legal, or investment advice — consult a qualified professional before making business decisions.